Transportation, Sustainability & Equity in the Inland Empire Scorecard
The Inland Empire Scorecard aims at quantifying and giving a score to the efforts of cities on three aspects related to transportation in the Inland Empire. These three aspects are transportation, sustainability, and equity. Transportation section scores the safety and mobility options to users. These consider the active transportation, transit, and the personal vehicle usage in the jurisdiction. The existing transportation efforts of the region are assessed through its active transportation plans, travel time to work, and vision zero commitments.
Sustainability in transportation aims to reduce environmental impacts, contribute to economic stability and growth, and sustain the social and cultural values of a region. These efforts are assessed through implementation of objectives such as habitat mitigation plans, trip reduction strategies, and zero emission vehicle sales and ownership.
Equity within transportation deals with accessibility, aiming to provide users the necessary access to resources such as job centers and essential services without compromising their health and needs. These equity goals are assessed through efforts such as environmental justice plans, anti-racism ordinances, and respiratory and cancer risks. Sustainability and equity are interrelated concepts, wherein initiatives need to be taken in both in order for lasting impacts to be made in the transportation systems within the Inland Empire.
After finding the information for the different criteria, and contacting the public records offices of each city to ensure we had the right info for all the categories, a score within 1-10 was given to each city for all categories. Last, the overall score of the cities was calculated by taking into account all of the criteria together. Scores of 4 or below are considered to not meet expectations, scores between 5-7 are within our expectations, and scores of 8 or higher are above expectations.
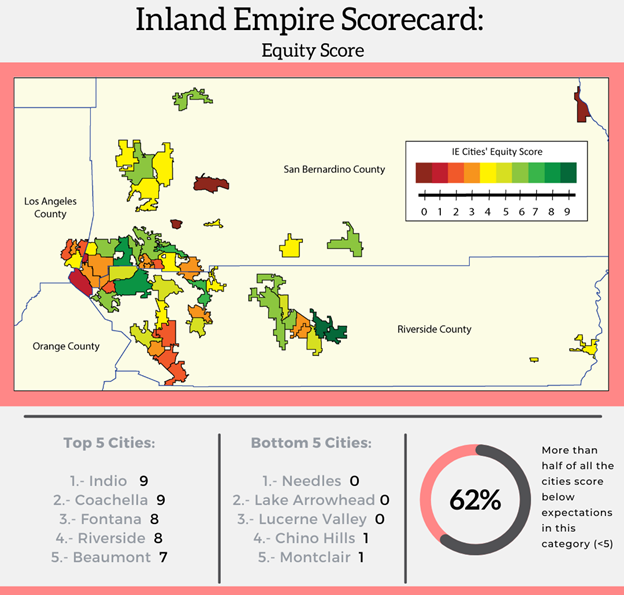
Equity was the category that had the most diversity in scores with a range from 0 to 9, equity being the only category where a city scored a 9. Despite this diversity most of the cities in the Inland Empire scored below expectation, with 62% of cities scoring 4 or less. Four percent of the cities scored above expectations, while 32% scored within expectations.
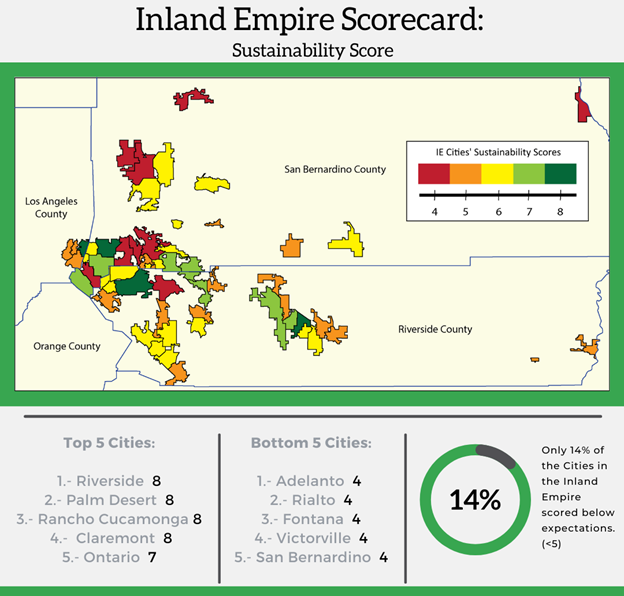
Sustainability was the category that cities in the IE did best at with an average score of 6. Only 14% of all the cities scored below expectations with none of those scoring lower than a 4. Seventy-nine percent of the cities scored within expectations, while 7% scored higher.
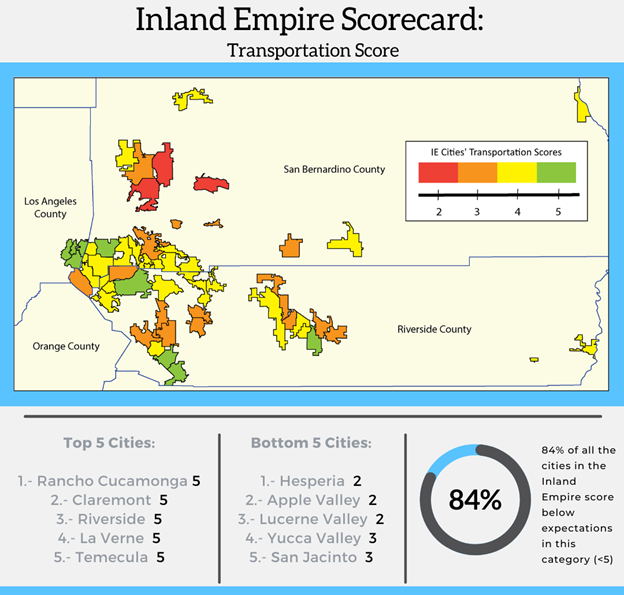
Transportation was the category that cities did the worse at with no city scoring above expectations and only 16% meeting expectations. Of the 84% of cities below expectations, more than half had a score of 4 meaning that perhaps some improvements in one or two of the criteria could allow them to meet expectations.
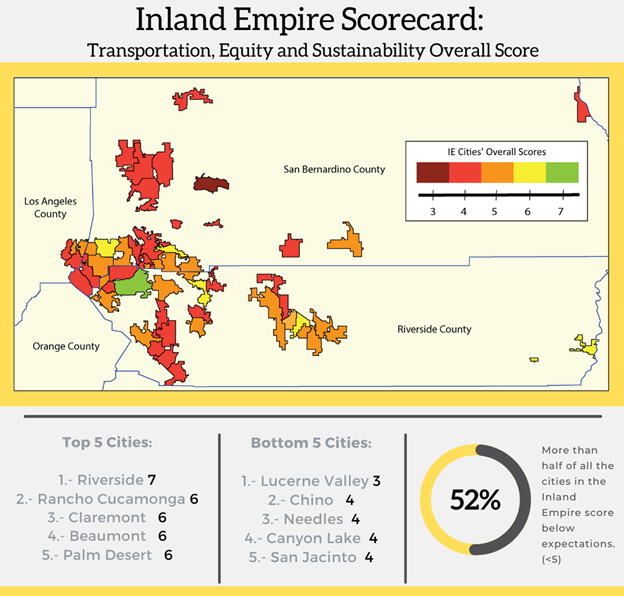
More than half of the cities scored below expectations with 29 out of the 58 cities scoring a 4, and one city scoring a 3. The rest of the cities were within expectations, with 22 cities scoring a 5, five cities scoring a 6, and one city scoring a 7.