Student Affairs Team Presented Improvements to Their Reporting Procedure
Click/Tap on an image for the PDF.
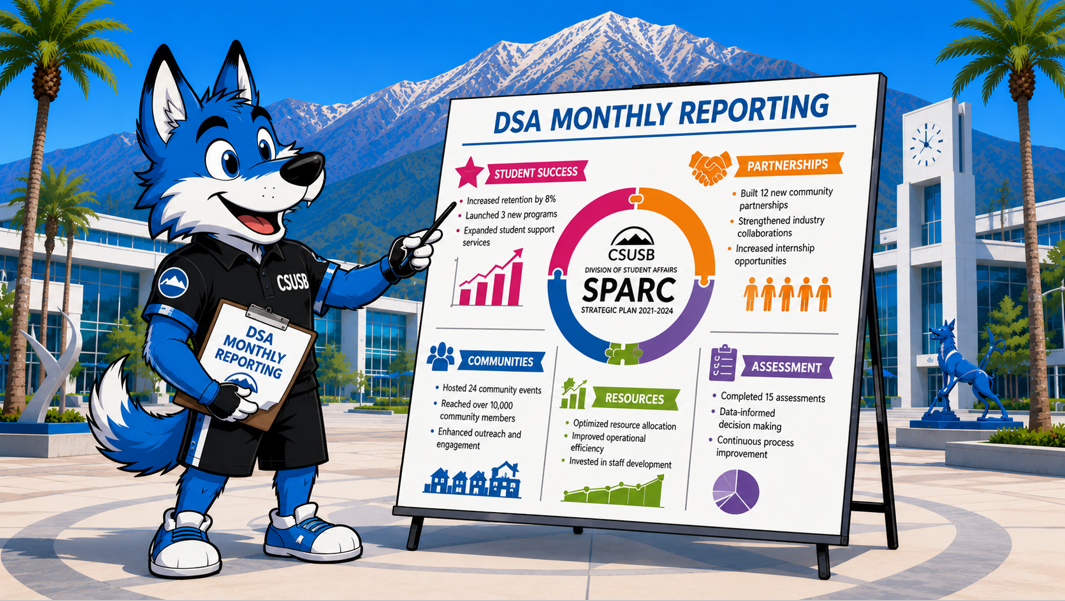
The SPARC Report helps departments document progress, showcase impact, and support data-informed decision-making aligned with divisional strategic priorities.
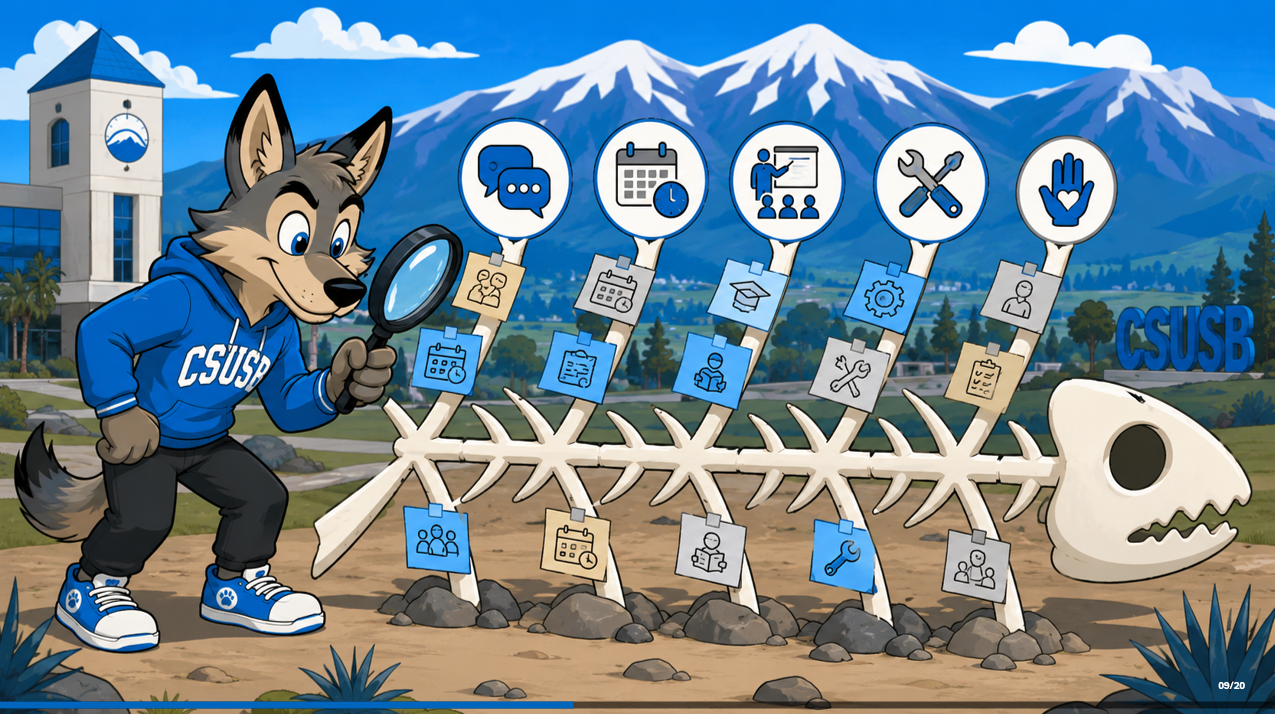
Using the Lean Six Sigma fishbone diagram, root cause analysis identified factors contributing to inconsistent reporting, including unclear expectations, limited training, insufficient reminders, tool design challenges, and unclear ownership of reporting responsibilities.
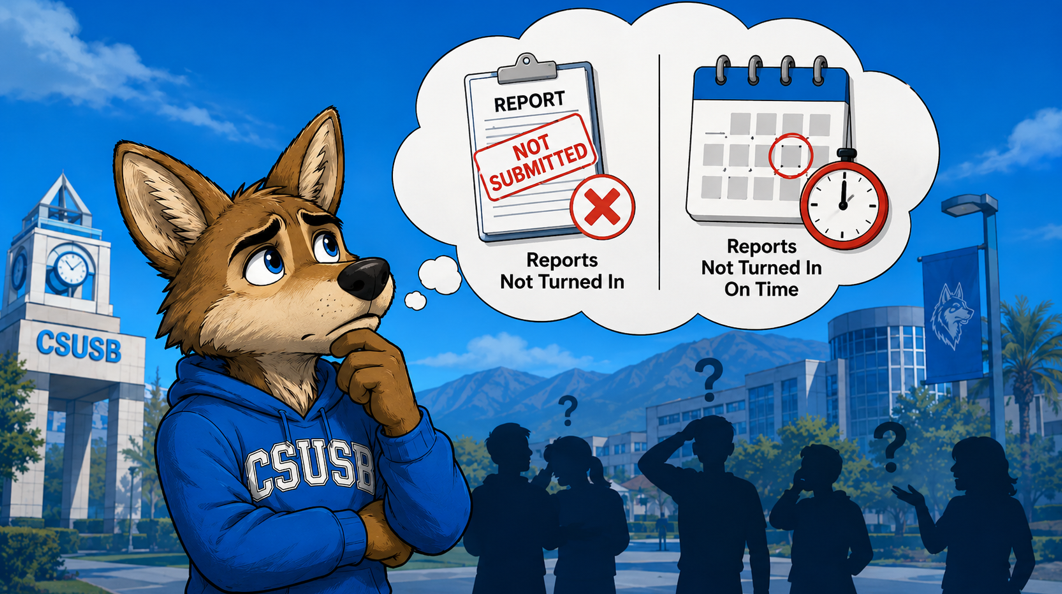
Some of the key contributors to missed or inconsistent SPARC reports include uncertainty about reporting requirements, competing priorities, unclear delegate assignments, and missed deadlines.

Transformed the SPARC reporting process from a confusing and inconsistent workflow to a streamlined system with clear expectations, defined responsibilities, and improved reporting practices.